Learn key software engineering KPIs to enhance project success and track vital metrics without micromanagement. Optimize your team's performance now!

Are you trying to measure your team’s success without the right tools? Tracking software engineering KPIs (Key Performance Indicators) is like giving your development team a GPS. Instead of guessing if you're on the right path, you get clear, data-driven directions that show you exactly where you are, where you're going, and how to get there faster. These metrics aren’t about micromanaging people; they’re about understanding your process, spotting bottlenecks, and making smart decisions that connect your team’s hard work directly to business goals.
Trying to guide a development team without solid metrics is like trying to navigate a ship across the ocean without a map or compass. You might be moving, but are you heading in the right direction? Software engineering KPIs are the instruments that give you clarity, direction, and a real sense of control, helping you swap gut feelings for decisions backed by hard data.
These metrics create a shared, objective language for everyone on the team. Imagine a real-world scenario: a product launch is delayed, and tension is high. Without data, the conversation can easily devolve into finger-pointing. But with KPIs, you can see that the code review stage is taking three times longer than usual. The problem isn't a person; it's a process bottleneck. This shifts the entire conversation from blame to collaborative problem-solving, nurturing a culture where everyone is focused on getting better together.
At the end of the day, an engineering team's job is to deliver value. KPIs are the bridge between the daily grind of coding and the high-level objectives of the business. They help you answer the tough questions that every team grapples with:
This sharp focus on measurable results is more important than ever. The global software development market is on a trajectory to explode from $203.35 billion in 2022 to an astonishing $1,450.87 billion by 2031. In such a fiercely competitive field, using KPIs to keep quality and efficiency high isn't just a nice-to-have; it's a fundamental requirement for survival and growth. You can learn more about the software development industry's massive growth and what it means for teams like yours.
When you embrace the right software engineering KPIs, you're giving your team the power to not just build software, but to build the right software, better and faster than before. It’s all about making smarter, more informed decisions that lead directly to high-quality, successful products. Tools like Sopa make tracking development workflows simple, so you can see if your team is truly aligned with your business goals.
To get a true picture of your engineering team's performance, you can't just fixate on one number. That's a rookie mistake. Real insight comes from a balanced perspective, which is why the most effective software engineering KPIs are usually grouped into a framework.
Think of it like building and running a high-performance race car. It’s not just about raw engine power. To win, you have to monitor the entire system—the engine, the chassis, the tires, and the pit crew.
This approach organizes your metrics into four essential pillars, with each one telling a critical part of the story. Looking at them together gives you a complete, actionable view of your engineering organization's health and effectiveness.
This is the engine of your race car—it’s all about raw speed and output. Development Velocity KPIs tell you how quickly your team can turn an idea into a real feature in the hands of your users. The whole point here is to find and eliminate friction in your development pipeline.
Key metrics include:
Code Quality is the car's chassis and safety features. It’s what keeps the car stable and prevents catastrophic breakdowns on the track. These metrics help you understand the integrity of the software you're building, ensuring that speed doesn't come at the expense of stability.
A high Change Failure Rate is a massive red flag. It’s a clear signal that your quality gates—like code reviews and automated testing—are failing to catch problems before they hit users. It’s a direct measure of how often a deployment introduces a bug.
This pillar measures how well your car actually performs during the race. Once your software is deployed, how stable is it? And how quickly can the pit crew fix a problem when something goes wrong? Operational Reliability metrics are all about the end-user experience and your team's ability to keep the system healthy.
Important KPIs here are:
Finally, Team Health is your skilled and coordinated pit crew. An exhausted, overworked, or disjointed crew can't support a winning car, no matter how powerful its engine is. These metrics are about sustainability, ensuring your team can perform at a high level over the long haul without burning out. They focus on workload balance, collaboration, and overall developer satisfaction.
To tie it all together, think of these four pillars as a complete diagnostic system for your engineering organization. Each one answers a different but equally important question about performance.
By monitoring metrics across all four categories, you avoid the classic trap of optimizing for one area (like speed) at the expense of another (like quality or your team's sanity). It's all about finding the right balance.
This infographic breaks down how these pillars contribute to overall performance.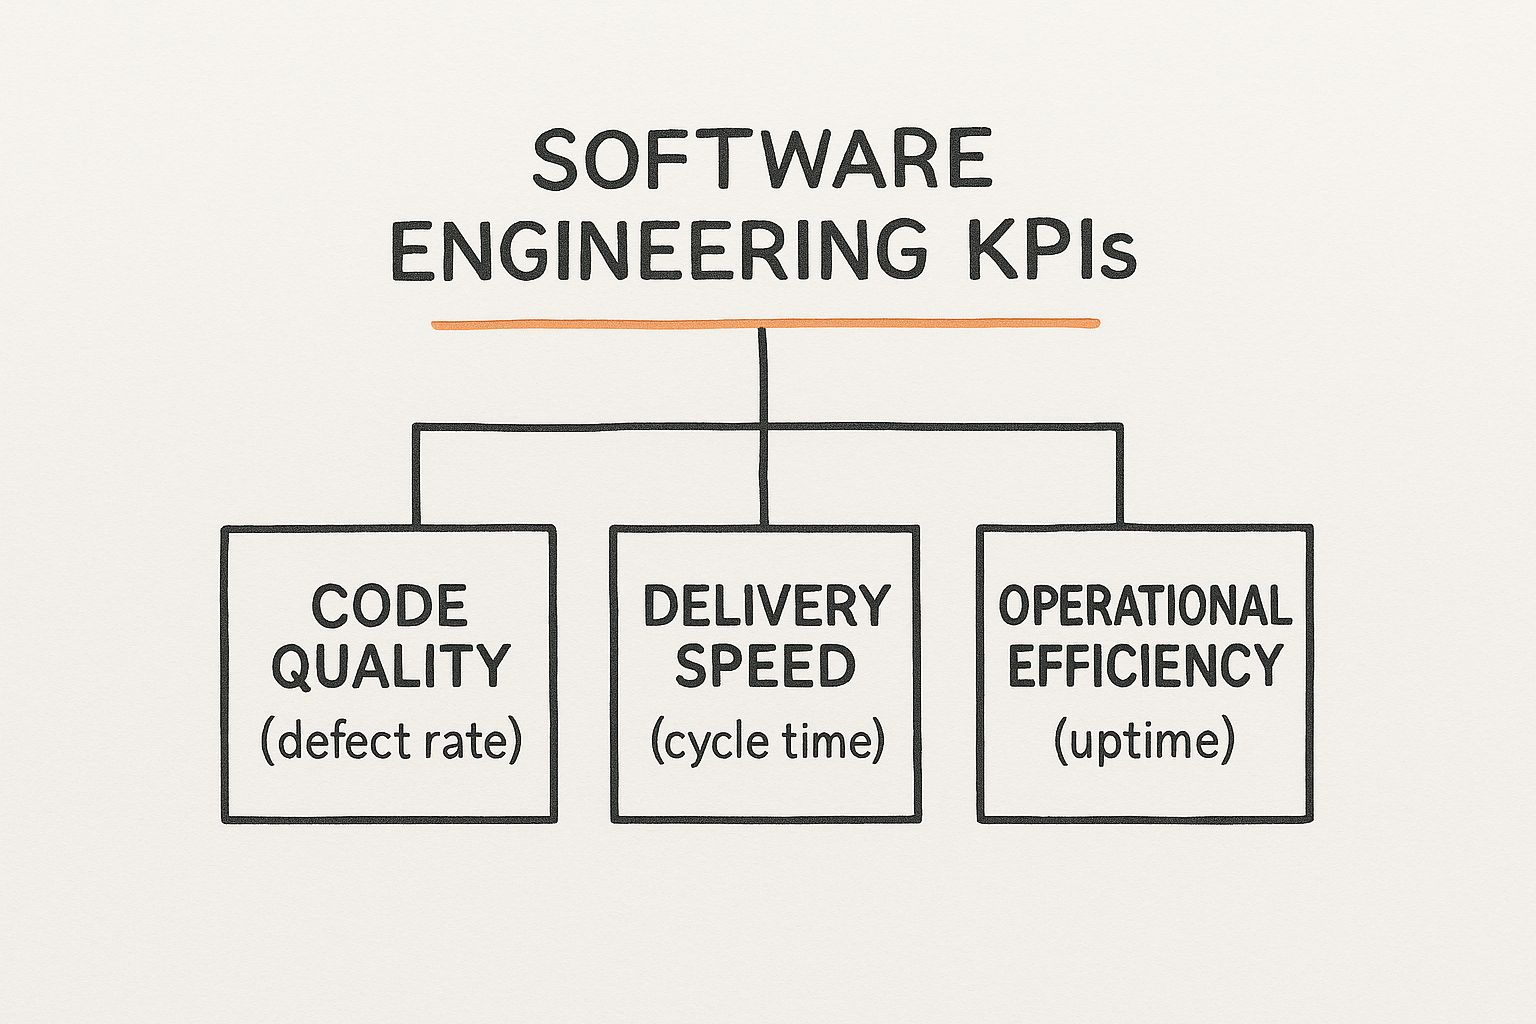
The diagram highlights that a balanced approach, considering speed, quality, and efficiency, forms the foundation of strong software engineering KPIs.
Picking the right software engineering KPIs isn't about hoarding data. It's about finding the specific numbers that will help you solve real problems and drive meaningful change. The best metrics are always tied directly to your team's biggest headaches and the company's overarching goals.
So, before you grab a generic list of KPIs off the internet, take a step back and ask some hard questions. What’s our single biggest bottleneck right now? Are we constantly fire-fighting stability issues? Do we feel like we’re falling behind competitors and need to ship features faster? Your answers will point you straight to the metrics that matter for you, right now.
Let's ground this in a real-world scenario. Imagine a startup just launched a new product. On paper, they look great—they're deploying code every single day. But beneath the surface, customer support tickets are flooding in and user reviews are turning sour because of all the bugs. This is a classic QA failure story.
In this case, their problem isn't speed; it's quality. If they only measured Deployment Frequency, they'd be patting themselves on the back while the product was actually failing. That metric would be actively misleading. What they need are KPIs that get to the heart of their stability problem.
For this team, a much better set of metrics would be:
By focusing on these specific KPIs, the team's entire mindset shifts from "shipping fast" to "shipping quality." They now have a clear, measurable way to see if they're actually building a more reliable product. Sopa offers a different approach from competitors by focusing on these outcome-driven metrics, which you can explore on our Sopa vs. Jellyfish comparison page.
This little story gets at a fundamental rule of good measurement: prioritize outcomes over outputs. An output is just an activity—think "lines of code written" or "number of tickets closed." An outcome is the actual result you want, like "happier customers" or "less server downtime."
A truly effective KPI framework blends everything from formal code metrics and productivity measures to test coverage and customer-centric scores. In fact, research shows that companies adopting these balanced systems see a 20-30% higher rate of on-time project delivery and a major boost in user satisfaction.
This balanced view ensures you're measuring what actually creates value. For a wider lens on performance indicators, exploring some top operational KPI examples can give you great ideas for what might be relevant for your engineering team.
Ultimately, by tying your software engineering KPIs to tangible business goals, you create a clear path from the day-to-day work of your developers to the overall success of the company.
Implementing software engineering KPIs can be a game-changer, but if you're not careful, they can do more harm than good. A well-intentioned metrics program can quickly sour, creating stress, mistrust, and unhealthy competition. The goal is always to find opportunities to improve the system, not to put individuals under a microscope.
The single most dangerous trap is weaponizing metrics. This is what happens when leaders use data to point fingers at engineers for missed deadlines or production bugs. As soon as KPIs become a stick to beat people with, developers will naturally learn to fear them. This breeds a toxic culture where people hide mistakes, shy away from taking risks, and focus all their energy on gaming the system instead of building great software.
Another easy pitfall is getting seduced by vanity metrics. These are the numbers that look fantastic on a dashboard but don't actually tell you anything meaningful about progress or value. They feel great to report up the chain, but they often just hide deep-rooted problems.
For example, imagine a team celebrating a massive jump in their Deployment Frequency. On paper, it looks like they're shipping code faster than ever before. But what's really happening? Their Change Failure Rate has also shot through the roof. That high deployment number is actually creating chaos, forcing engineers to constantly put out fires in production. They're shipping more often, but the quality of the product is tanking.
Metrics should be a starting point for curious questions, not a final judgment. Instead of asking, "Why is your cycle time so high?" try asking, "What's getting in the way of a smoother workflow?" This simple change reframes the conversation from blame to collaboration.
To sidestep these issues, you have to build a culture of psychological safety around your metrics. Make it clear from the get-go that KPIs are about understanding the health of the entire system—the processes, the tools, the workflows—not about grading individual performance.
Here are a few practical ways to keep your KPI program on the right track:
By making these practices part of your engineering culture, you can make sure your software engineering KPIs truly support growth, transparency, and a spirit of continuous improvement.
So, you’ve picked your software engineering KPIs. Now what? The real challenge isn’t just choosing the right metrics, but bringing them to life in a way that’s actually useful.
Sticking with manual methods, like pulling data into spreadsheets, is a recipe for headaches. It's not just slow and full of potential for human error; it gives you a static snapshot that's probably out of date the moment you finish compiling it. To get real value, you need to shift from manual tracking to automated, real-time visualization.
This is where engineering intelligence platforms come in. These tools are built to plug directly into the systems your team already lives in—think Git repositories like GitHub or GitLab and project management tools like Jira. They work in the background, hoovering up data and turning raw activity into clean, insightful dashboards without anyone having to lift a finger.
Imagine a world where developers, product managers, and team leads are all looking at the exact same data. That's the power of a centralized dashboard. It creates a unified, real-time view of project health, establishing a single source of truth for everyone involved.
This alignment is a game-changer. When everyone trusts the data, conversations stop being about whether the numbers are correct and start focusing on what the numbers are telling us. This simple shift creates a more collaborative atmosphere, where the team can spot a bottleneck and swarm it before it derails a sprint. To get a better sense of how this data pipeline works, it's worth understanding the fundamentals of a real-time analytics workflow.
The true power of a KPI dashboard isn't just in displaying numbers; it's in telling a story about your development process. It reveals where friction exists and highlights opportunities for improvement that would otherwise remain hidden.
With a live look into your team’s workflow, you can catch negative trends the moment they start. Is Cycle Time starting to creep up week over week? Did the Change Failure Rate spike right after that last big release? An automated dashboard makes these patterns impossible to ignore, giving you a chance to step in early.
This proactive stance means you can tackle problems like a code review process that’s becoming a bottleneck or a growing mountain of technical debt before they seriously impact your delivery schedule and code quality. In fact, many modern platforms are integrating AI to improve code quality—something we cover in our guide to AI code review tools.
Ultimately, visualizing your software engineering KPIs is about making your data work for you. It’s how you move from just collecting numbers to actively using insights to make your entire development lifecycle faster and smoother.
Running an engineering team is hard enough. Running one that's scattered across different offices, time zones, or even continents? That's a whole different ball game. When your local engineers are working with an outsourced team on the other side of the world, things like communication and quality control can start to fray at the edges.
This is where having a clear, shared set of software engineering KPIs becomes absolutely critical. They stop being just numbers on a dashboard and transform into a common language that helps align everyone on what success actually looks like.
Let's be real, this is the new normal. The global IT outsourcing market isn't small—it was valued at $526.6 billion in 2021 and is on track to hit $682.3 billion by 2027. This shift means we need KPIs that are built for the complexities of working across borders. Get this right, and you can tap into global talent and save money without sacrificing quality. You can find more details in these software engineering trends.
I once saw a tech startup bring on an outsourced team to help them move faster. It didn't go smoothly at first. The in-house engineers felt the code from the new team wasn't up to snuff, while the outsourced developers felt like their pull requests were stuck in a slow, confusing review process. You could feel the tension, and predictably, everything slowed down.
The breakthrough came when they stopped pointing fingers and started looking at the data together. They agreed on a few core KPIs that both teams would be measured against, creating a single source of truth.
Here’s what they focused on:
The moment they put these KPIs on a shared, visible dashboard, the "us vs. them" attitude started to disappear. The data wasn't a weapon; it was a tool for spotting problems in the system that impacted everybody.
That transparency was the key. It built trust and a sense of shared ownership. Soon, the teams were working together to fix a clunky code review process and improve their testing. For distributed teams, good KPIs are the glue that holds your engineering culture together, no matter how many miles are between you.
Sopa gives you the visibility to get your distributed teams aligned around the metrics that truly matter. Start your free trial today and discover how a shared view of performance can completely change how your global team works together.
Diving into software engineering KPIs always stirs up a few common questions. Let's tackle them head-on with some practical answers to help you get your metrics program right and build on what we've already covered.
The honest answer? It depends entirely on the metric. Think of it like checking different gauges on a car's dashboard.
Some metrics are your speedometer—you need to glance at them often. Things like Cycle Time or Deployment Frequency are fast-moving indicators. It makes sense to bring these up in weekly or bi-weekly team retrospectives. This lets you catch problems early and make quick course corrections before they become major issues.
Other metrics are more like your car's long-term maintenance schedule. Measures like Team Satisfaction or Code Coverage tell a bigger story over time. Looking at these monthly or quarterly is usually best. It helps you see the real, meaningful trends without getting distracted by tiny, insignificant blips from one week to the next. The key is to find a review rhythm that actually leads to action, not just staring at charts.
In a word: no. I strongly advise against this.
The moment you tie individual bonuses or performance reviews to a specific metric, you've accidentally created an incentive to game the system. Developers might start shipping tiny, meaningless changes to boost their deployment frequency or rush code to lower their cycle time, tanking quality in the process. It's a natural human response, but it can be incredibly toxic to team morale and genuine collaboration.
KPIs work best when they're treated as a health check for the entire system—the team, the process, the code. They should be conversation starters for improvement, not weapons for individual judgment.
This is a classic question, but there's no silver bullet. The "best" KPI is completely dependent on your team's specific goals and current challenges.
However, if you're just starting out and need a powerful, well-rounded foundation, you can't go wrong with the four DORA metrics. They are:
Why these four? Because together, they give you a fantastic, balanced picture of both your team's speed and its stability. These are the two pillars that pretty much every successful software team is built on. From there, exploring other software engineering KPIs will help you tailor your measurement strategy to what your team truly needs.
Ready to stop guessing and start making data-driven decisions? Sopa gives you the clarity you need to track the KPIs that truly matter, clear out bottlenecks, and cultivate a high-performing engineering culture. Start your free trial today and see what your team is truly capable of.